AI-Powered Standard Data Analysis Reports
Real Workflow
This scenario suits periodic reports. The real pain point isn't "can't analyze"—it's having to repeat data extraction, template filling, chart creation and writing the same structure of conclusions every time.
| Dimension | Real Situation |
|---|---|
| Trigger Point | Sales weekly reports, operations monthly reports, financial quarterly reports, departmental business analysis—fixed-cycle reports |
| Existing Materials | Current period data, previous report, company template, metric definitions, chart style requirements |
| Pain Point | Multi-department data formats inconsistent, report template fixed but filling tedious, anomaly explanations easily missed |
| DesireCore Intervention | Data analysis report agent generates department reports and summary version according to template, and highlights abnormal metrics |
| Acceptance Result | Analyst focuses on checking anomaly explanations and management suggestions, no longer spending time on copy-paste and formatting |
What It Can Do
📥 Multi-Source Data Ingestion
- Excel / CSV: Automatically identifies headers and data types, handles merged cells
- Database Queries: Supports MySQL, PostgreSQL, SQLite; natural language to SQL
- API Data Sources: Connects to business systems to pull real-time data
📋 Report Template Management
- Pre-built Template Library: Sales reports, operations reports, financial reports, and other common templates
- Custom Templates: Supports uploading enterprise standard templates and defining chapter structures
- Style Inheritance: Fonts, color schemes, and chart styles consistent with corporate VI
📊 Intelligent Analysis & Visualization
- Automatic Statistical Analysis: Auto-calculates common metrics like totals, MoM, YoY, and proportions
- Smart Chart Generation: Automatically selects bar charts, line charts, pie charts, etc. based on data characteristics
- Anomaly Highlighting: Automatically identifies data outliers and highlights them in the report
- Trend Interpretation: Automatically generates textual analysis conclusions based on data changes
📄 Standard Format Output
- Word Documents: .docx format conforming to enterprise templates, directly editable
- PDF Reports: Beautifully typeset, suitable for distribution and archiving
- PPT Presentations: Automatically generates presentation slides
- Online Preview: Preview before generation, with fine-tuning support before export
Workflow Control Points
| Stage | Details to Confirm |
|---|---|
| Data Ingestion | Whether each department's data range, time scope, field names and units are consistent |
| Data Cleaning | Whether there are empty values, duplicate rows, outliers, merged cells and inconsistent category names |
| Metric Calculation | Whether MoM, YoY, proportion, average order value etc. use company unified definitions |
| Chart Generation | Whether charts serve conclusions, not just "looking good" by stacking charts |
| Text Conclusions | Whether each conclusion can be traced back to specific data, charts or business explanations |
| Template Output | Whether title, table of contents, headers/footers, chart styles and export format meet company standards |
DesireCore Capabilities Used
- Workflow / SOP: Solidify monthly, weekly and quarterly report processes into fixed steps, reducing repeated instructions
- Multi-Agent Collaboration: Data Analyst handles calculations and charts, AI Copywriter handles report text and layout
- Scheduled Tasks: Can automatically generate periodic reports or remind you to supplement data sources at fixed times
Typical Use Cases
Scenario 1: Consumer Industry Sales Data Analysis Report
File location: ./assets/data-analysis/case1/Consumer_Industry_Sales_Data_Analysis_Report.docx
📁 Input
    ├── Sales_Data.xlsx (350 records, covering 7 major regions, 140 cities)
    └── User instruction: "Generate a consumer industry sales data analysis report"

⬇️ Agent processing (approx. 3-5 minutes)

📄 Output: Consumer_Industry_Sales_Data_Analysis_Report.docx
    ├── 📌 I. Executive Summary
    │   └── Annual total sales ¥63.27 million, total volume 285,807 units
    ├── 📊 II. Key Metrics Overview (table)
    │   ├── Total Sales: ¥63,274,132.42
    │   ├── Total Volume: 285,807 units
    │   ├── Avg. Order Value: ¥241.13
    │   └── Cities Covered: 140
    ├── 🗺️ III. Regional Sales Analysis
    │   ├── Regional sales proportion pie chart
    │   └── Conclusion: East China region accounts for 20.5%, best performance
    ├── 🏷️ IV. Product Category Analysis
    │   ├── Category sales comparison bar chart
    │   └── Conclusion: Digital & home appliances highest at ¥28.27 million
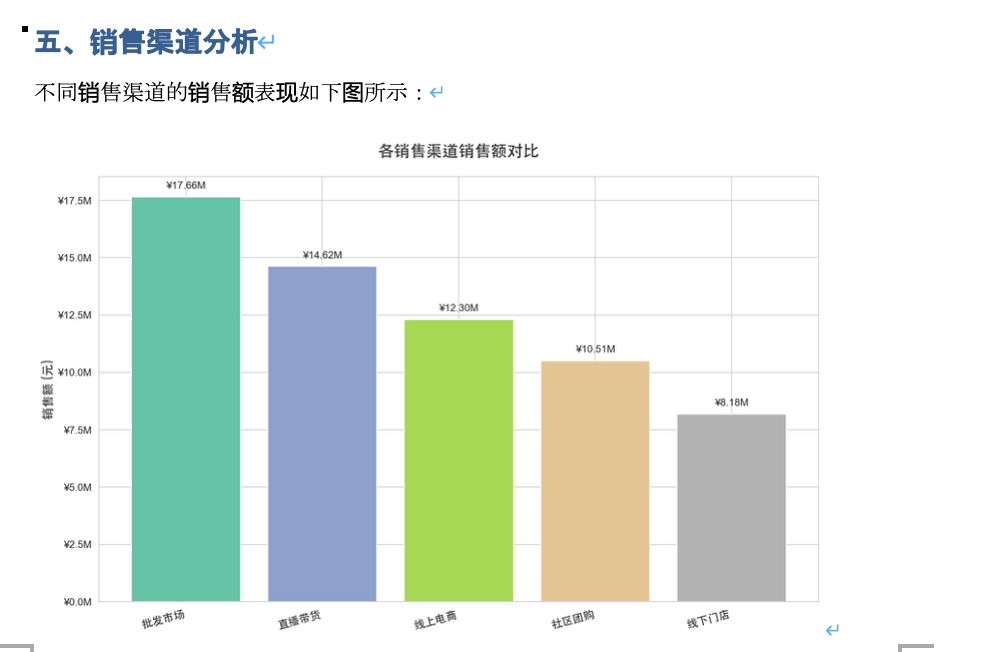
    ├── 🏪 V. Sales Channel Analysis
    │   ├── Channel sales comparison chart
    │   └── Conclusion: Wholesale market channel leads at ¥17.66 million
    ├── 📈 VI. Monthly Sales Trend
    │   ├── Monthly sales line chart
    │   └── Conclusion: October peak, August trough, seasonal fluctuation
    ├── 🏙️ VII. City Sales Ranking
    │   ├── TOP10 cities bar chart
    │   └── Conclusion: Changzhi ¥2.79 million tops the list
    ├── 🔍 VIII. Volume vs. Sales Relationship Analysis
    │   ├── Category scatter plot (volume vs. sales)
    │   └── Conclusion: Digital & home appliances high unit price, food & beverage relies on high volume
    └── 💡 IX. Conclusions & Recommendations
        ├── Key Findings (5 items)
        └── Strategic Recommendations (5 items)
Scenario 2: Batch Operations Monthly Report Generation
📁 Input
    ├── Operations data from each business line (5 departments)
    ├── Standard operations monthly report template
    └── User instruction: "Generate independent monthly reports for each department"

⬇️ Agent processing (approx. 8-10 minutes)

📄 Output
    ├── Product_Ops_Monthly_Report_202404.pdf
    ├── Marketing_Ops_Monthly_Report_202404.pdf
    ├── Customer_Service_Ops_Monthly_Report_202404.pdf
    ├── Tech_Ops_Monthly_Report_202404.pdf
    ├── Sales_Ops_Monthly_Report_202404.pdf
    └── Company-wide_Ops_Summary_202404.pdf
Scenario 3: Financial Quarterly Report
File location: ./assets/data-analysis/finance_q1_report
📁 Input
    ├── Q1 financial data (revenue, cost, profit details)
    ├── Financial report template (including audit-required format)
    └── User instruction: "Generate Q1 financial analysis report"

⬇️ Agent processing (approx. 5-8 minutes)

📄 Output: 2024Q1_Financial_Analysis_Report.pdf
    ├── Financial Summary (key metrics overview table)
    ├── Revenue Analysis (by product line, by region)
    ├── Cost Structure (YoY change analysis)
    ├── Profit Analysis (gross margin, net margin trends)
    ├── Cash Flow Overview
    └── Risk Alerts & Recommendations
Efficiency Comparison
| Metric | Manual Report Creation | Fixed Script Generation | AI Agent |
|---|---|---|---|
| Single report time | Usually takes hours | Fast after development complete | Suitable for generating reviewable first drafts |
| Batch generation (10 reports) | Easily filled with formatting and copy-paste | Suitable for fixed formats | Suitable for batch tasks with same template, different data sources |
| Template adaptation cost | Manual adjustment each time | Code modification required | Natural language description |
| Anomaly analysis capability | Relies on human experience | Requires preset rules | Assists identification |
| Conclusion writing | Manual | None | Generates first draft |
| Format consistency | Error-prone | High | High |
Usage Suggestion
These periodic reports are best suited for solidifying templates and metric definitions first. Once the template is stable, each month mainly checks anomaly explanations and management suggestions—no need to repeatedly adjust formatting.